What resolution do you need to spot roof staining and patching from above?
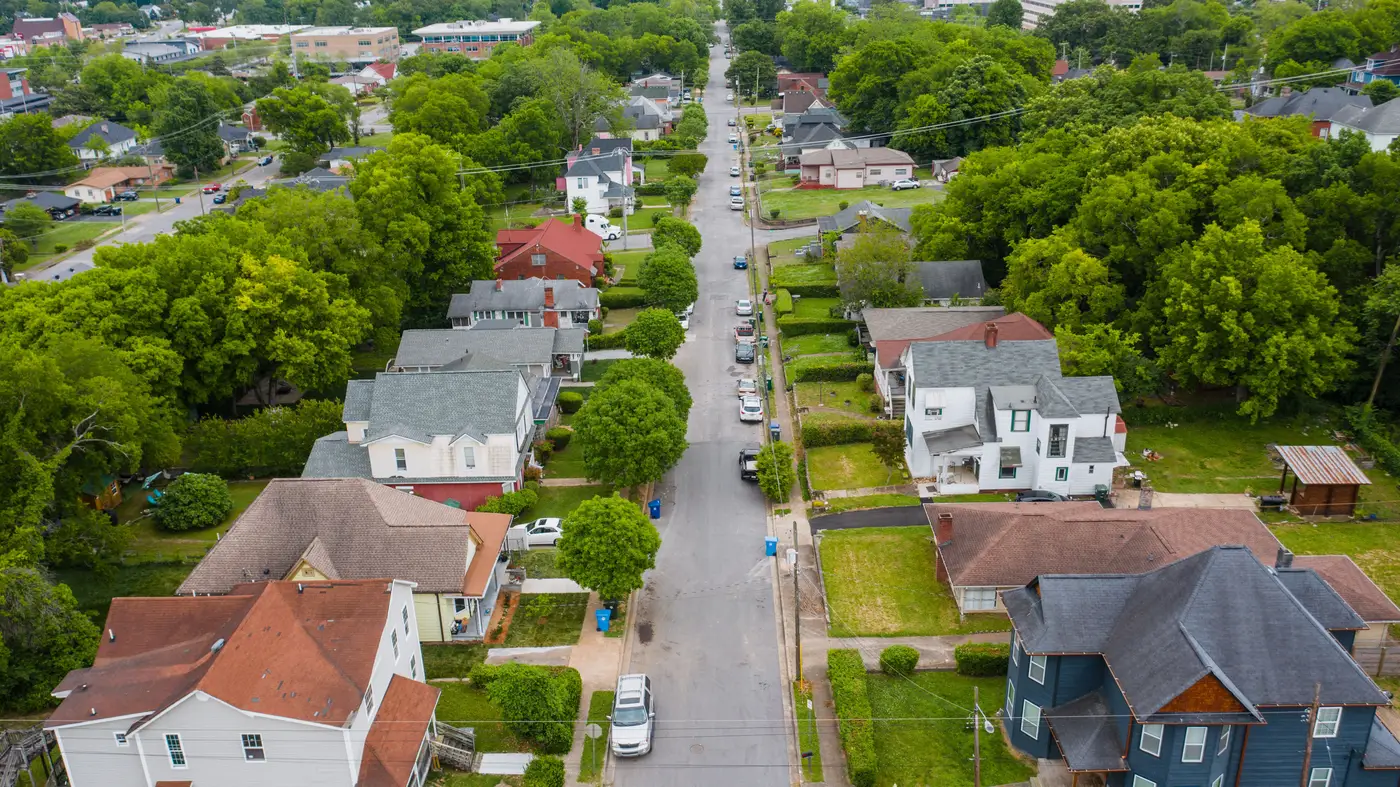
Ground sample distance, or GSD, is the size of the real-world area one pixel covers in an image. A 1-meter GSD image means each pixel represents a 1-meter square on the ground. A 0.3-meter GSD image means each pixel covers roughly a foot. For reading roof staining and patching from above, that difference decides whether you see a defect or just see a roof. Pull a satellite image into a claims file and squint at a rooftop trying to tell a tarp from a shadow, and you find out fast which side of that line your imagery falls on.
Why resolution is the first filter, not an afterthought
Staining shows up as a discoloration pattern, often a dark streak running from a vent or valley down toward the eave. Granule loss shows up as a mottled or washed-out patch where the shingle's protective coating has worn thin. Patching shows up as a color or texture mismatch, a different shingle lot or a tarp stapled over a soft spot. None of that is a hard edge.
It's texture and tone variation across a few square feet of material. If your source imagery can't resolve features smaller than a meter across, those signals get averaged into noise before you ever open the file. You'll see "roof," full stop. You won't see the roof.
This is also why coverage stats on their own don't tell you much. A provider can have beautiful nationwide coverage at 1-meter GSD and still be useless for this job, because the pixels are too coarse for the thing you're trying to read. Resolution and coverage are separate questions, and for staining and patching, resolution comes first.
What 0.3 meters gets you that coarser imagery doesn't
At 0.3m GSD, a single pixel covers about the width of a shingle course. That gives enough contrast and shape information to pick out a stain line following a roof valley, a patch of granule loss near a chimney, or a tarp's edge against the surrounding field, enough for a reviewer, or a model trained on the same patterns, to flag the roof as worth a closer look.
Compare that to the 1 to 3 meter imagery that shows up in a lot of free or low-cost satellite feeds. At those resolutions a whole roof might be a dozen pixels. You can tell there's a structure there and maybe its rough footprint. You cannot tell whether the discoloration you're looking at is a stain, a shadow from the HVAC unit, or just the way the shingles were laid. For anything tighter than "does a roof exist at this address," sub-0.3m is where the imagery starts earning its keep. That's the VHR tier, very high resolution, and it's the floor for this kind of work rather than a nice-to-have upgrade.
Annual cadence, not a live feed
High resolution and real-time capture are different things. VHR satellite and aerial imagery at this detail level typically runs on an annual capture cycle in most programs, not a daily refresh. For a renewal book, that's the right cadence anyway: a defensible read on roof condition once a year, ahead of renewal, across every address on the book rather than the handful that trigger a claim or a complaint.
That's the gap Roof Scoring was built to close: VHR imagery at 0.3m GSD or finer, reviewed annually, turned into a per-address record you can sort against your own underwriting thresholds instead of a stack of individual images nobody has time to open one by one. If you're currently deciding which roofs need a second look based on imagery that can't show you staining or patching, it's worth seeing what the per-address roof condition scoring looks like on your own book before the next renewal cycle.
Worth a look before your next renewal pass.